
Site loading speed is one of the important metrics that you need to consider if you are the owner of a website. It becomes even more crucial if you are running an online store on your website. GTmetrix is one of the popular tools that you can use to test the speed of your website. In this article, we will discuss how to use GTmetrix effectively to understand and enhance website performance.
Overview
GTmetrix is a simple tool that will give you different performance metrics related to website speed, which you can analyze and use to optimize your site’s performance. It has different options to test your site’s speed in different browsers, varied network speeds, and in multiple locations. Gtmetrix is powered by Lighthouse, Google’s automated tool that helps in improving site performance.

GTmetrix scoring system
The results offered by GTMetrix are quite easy to understand and will help even new users to easily make improvements. It involves a scoring system that displays a GTmetrix grade, as well as Performance and Structure scores. You can also get deeper insights through graphs and other visualizations.
GTmetrix used to have Page Speed/YSlow reports, which have been replaced with the Lighthouse scoring system. It is further augmented to create the GTmetrix grade.
GTmetrix grade
The GTmetrix grade provides an idea of your site’s performance taking into account the loading time, visual stability and interactivity. It is actually a combination of your site’s frontend structure and the performance experienced by an actual user.
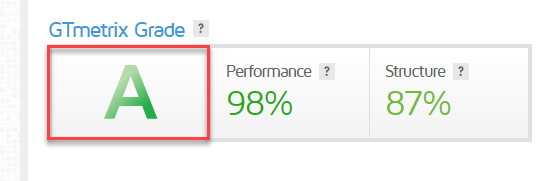
Currently the grade is an average of two scores – Performance and Structure.
Performance is the Lighthouse score, which is obtained through GTmetrix custom audits, along with different browser and hardware specifications. Structure is a proprietary assessment done by GTmetrix on your Lighthouse Opportunity and Diagnostic audits. Overall, your Structure score will give an idea on how well your site is built for an optimized performance.

GTmetrix Dashboard
Now we will get into more details on the results page.
Summary tab
The summary tab provides a brief overview of all your performance indicators in a structured manner. You can gain insights and initiate performance improvements with information from this tab alone.
The following aspects are visible here:
- Speed visualization – a visual indicator of how your page loads and what the actual user experience is.
- Top Issues – this is a summary of top issues on your page.
- Page details – a graph that denotes what requests are included in your page and how it impacts the page size.
- Additional tips – further help and suggestions from the GTmetrix team.

Performance tab – the user perspective
This score gives you a clear idea on your site’s performance from a user perspective. The metrics include different scores compiled together to form the final Performance score. The following are the metrics that will be displayed on a GTmetrix performance report:
- First Contentful Paint – gives an indication on the speed with which images and text are painted on to your page. 0.9s or less is a good score.
- Speed Index – indicates how fast content on your page are visibly populated. 1.3s or less is a good score.
- Largest Contentful Paint – determined by how the largest content element is painted. 1.2s or less is considered to be a good score.
- Time to Interactive – the time it takes for your page to be fully interactive. This score should be 2.5s or less to have a good user experience.
- Total Blocking Time – denotes the time blocked by scripts while the page is loading. 150ms or less is thought to be a good user experience.
- Cumulative Layout Shift – indicates the shift in page layout while loading. 0.1 or less is a good score.
There will be color coding to indicate the impact of each metric.

Structure tab – optimal performance indicator
The Structure tab shows the results of Lighthouse audit, which is further assessed by the GTmetrix team and assigned different values. Please note, the results here are not an indication of your site’s performance, but they are best practices suggested by Google for optimal performance. You can implement these suggestions for a potential improvement of your site performance.
The Structure store also involves some custom audits done by the GTmetrix team in addition to the standard Lighthouse audits. These are:
- Enable keep alive – reduces latency
- Combining images using CSS sprites – for small images to improve performance.
- Use a content delivery network – to provide a fast experience for users all over the world.
- Avoid CSS@import – avoiding the process of calling stylesheets from within another CSS
On the structure tab, different audits are displayed with color coding based on their impact. Some audits with no impact will be hidden. You can click ‘Show No Impact Audits’ to view them.
There are also links on this tab that will help you find help from experts to optimize your site performance.
The Waterfall tab
This tab visualizes loading behavior and you will be able to understand how different requests on the page are loaded, and in what order. There are different graphs displaying the size and load time breakdown. On the waterfall visual representation, you will find the data organized in these forms:
- URL – This is the resource that is loaded. You can filter these into HTML, CSS, JS, XHR, Fonts, Images, etc.
- Status – This is the service request number. For successful requests, the code will be 200.
- Domain – The domain denotes where the file is loaded from. It could be from your own domain, or from third party sources like YouTube embed, or from CDN.
- Size – This indicates the size of the loaded resource. If you notice larger file sizes in images or videos, it is crucial to fix them to improve page loading speed.
- Timeline – Here you can understand the specific time required to load each resource. By a close examination of this information, you can deduce critical performance issues.

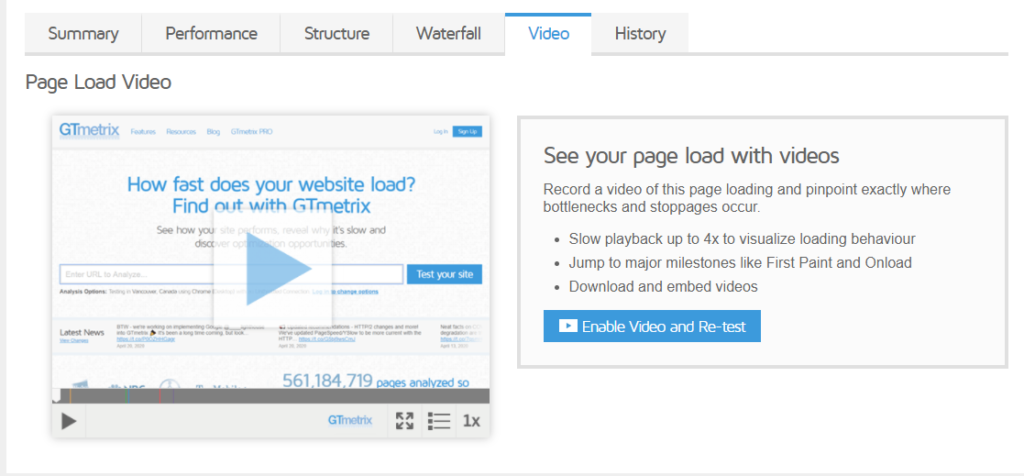
The Video tab
You can enable a video and re-test here to see how your page is loading. This will help you identify any specific problems in page loading and easily improve them. Here, you will find additional options for slow playback, or jump to specific milestones, etc.
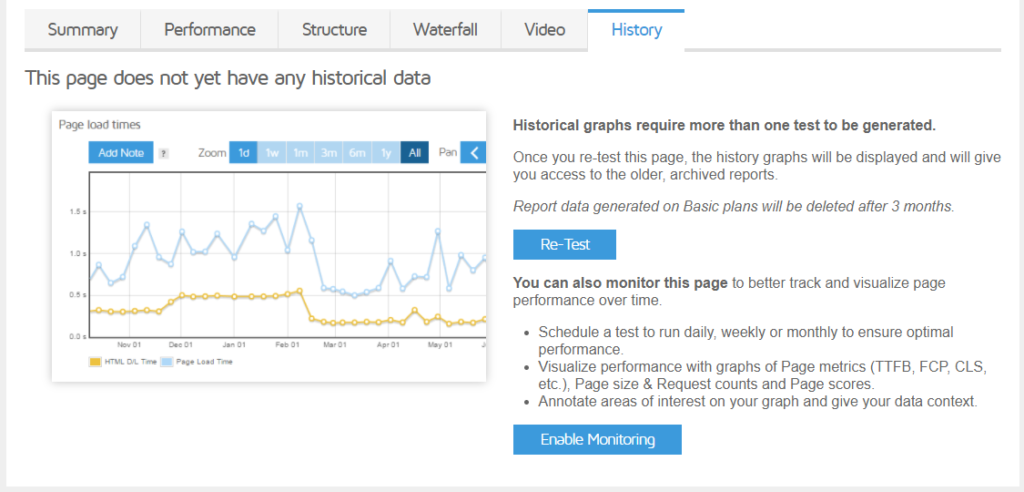
The History tab
One of the important recommendations to get best results while doing a speed test is doing multiple tests. This tab provides information on any tests that you have done in the past with your account. If you have tested a page at least twice, the historic report of that page will be generated and stored. Please note, the data generated using Basic plans will be deleted after three months.
Plans and Pricing of GTmetrix
Gtmetrix offers basic, free plans, along with advanced PRO plans. Here we take a look at the different plans available for individuals currently.
- Basic – With the basic plan, you will be able to monitor one page daily, with 50 weekly on-demand tests. You will get 10 API credits and data retention for three months.
- Solo – With the Solo plan, you will get daily monitoring option for 3 pages and 150 weekly on-demand tests. Also, there will be 25 API credits and data retention for 6 months. The cost is $10.
- Starter – The main attraction of this plan is that you will get 6 hourly page monitoring options. The number of weekly on-demand tests is 175, and API credits will be 50. Data will be retained for 6 months. This will cost you $20
- Growth – With this plan, you can monitor 12 pages in an hour. 250 weekly on-demand tests, and 100 API credits will be available with the plan. Data retention is for 6 months. The price is $40.
All Pro plans will have Global monitoring, premium test locations, and mobile device testing. In addition, for Pro plans, you will get the following benefits:
- Faster tests than Basic users.
- Better analysis options like changing screen resolution, altering device pixel ratio, etc.
- Special video capture for alerts.
- Additional data points in historic reports.
- Detailed PDF reports.
- Option to run more tests without wait period.

For bigger teams and enterprises, there is another pricing option, as follows:
- Champion – $60
- Team – $160
- Enterprise – $425
More details on pricing for companies are in the below screenshot.

How guest users can use GTmetrix?
Guest users can test the performance of web pages using Gtmetrix. However, compared to the Basic plan that you will get while logging in, this one is limited. The testing location will be Vancouver, and with an unthrottled connection on Chrome browser. When you sign in, you will get 6 more test locations (Hong Kong, London, Mumbai, San Antonio, Sydney, Sao Paulo). You will be also able to simulate more connection types when you log in.
Furthermore, you will get options to create videos and block ads from loading when you login to the Basic plan.
How to get the best out of website performance tests?
Here are some interesting tips to help you get the best out of these speed tests.
- Do multiple tests – To be able to get a clear understanding of website performance tests, you need to run multiple tests. Experts suggests testing at different times of the day.
- Choose a test location closer to your hosting server and target audience – It is important to choose test locations that are closer to your server and target audience. However, if you have audience spread across the world, you may need to use multiple test locations. GTmetrix offers 7 different locations with its Basic plan, while there are much more options with the Pro plans.
- Test different pages – Do not limit your tests only to the homepage. For example, in the case of an eCommerce store, the store or product page will be equally or more important than the homepage.
- Do not ignore mobile devices – It is important to understand how your site is loading on mobile devices. There are chances that the site loading speed is markedly different on mobiles.
- Try different connection speeds – You will get a clearer idea of your page loading speed, if you test it with multiple connection speeds. With the basic plan of Gtmetrix, you can try different connection speeds.
We hope this article has provided you with a good understanding of GTmetrix, and how it can be used to improve your website performance. If you would like to share your experience with this tool, or if you have any queries or concerns, feel free to leave us a comment.


")
")
")