
Last updated - July 26, 2022
While managing an eCommerce store, you need to gather insights on different aspects that drive traffic and conversions. Constantly monitoring analytics insights will help you understand trends and customer preferences better. In the latest versions, a new section called WooCommerce Analytics is included, which offers detailed analytics reports. In this article, we will take a detailed look at all the reports available in the WooCommerce Analytics section.
Getting started with WooCommerce Analytics
You can access the Analytics section from the WordPress admin panel.
Overview
When you click this section, you will see an Overview page. Let us first familiarize ourselves with this page first. First, you will see an option to pick a date range. Also, there are three sections here – Performance, Charts and Leaderboards. We will see each in detail.
Date Range
You can start by choosing a date range for the data that you want to see.
Here, you will see Presets as well as Custom options.
Under Presets, you can choose the following options:
- Today
- Yesterday
- Week to Date
- Last Week
- Month to Date
- Last Month
- Quarter to Date
- Last Quarter
- Year to Date
- Last Year
Each option you can choose to compare with Previous Period or Previous Year.
Once you choose the required options, you can click the Update button.
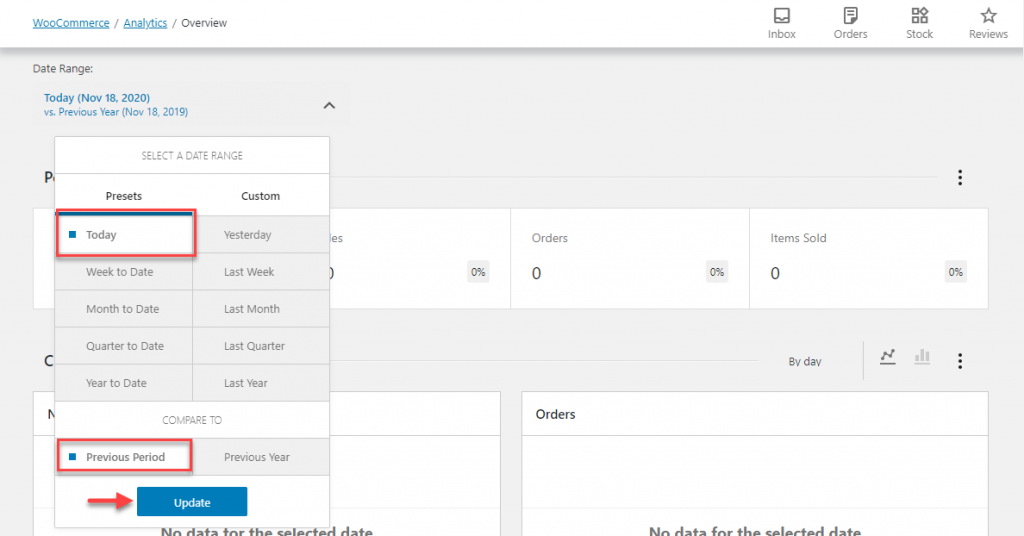
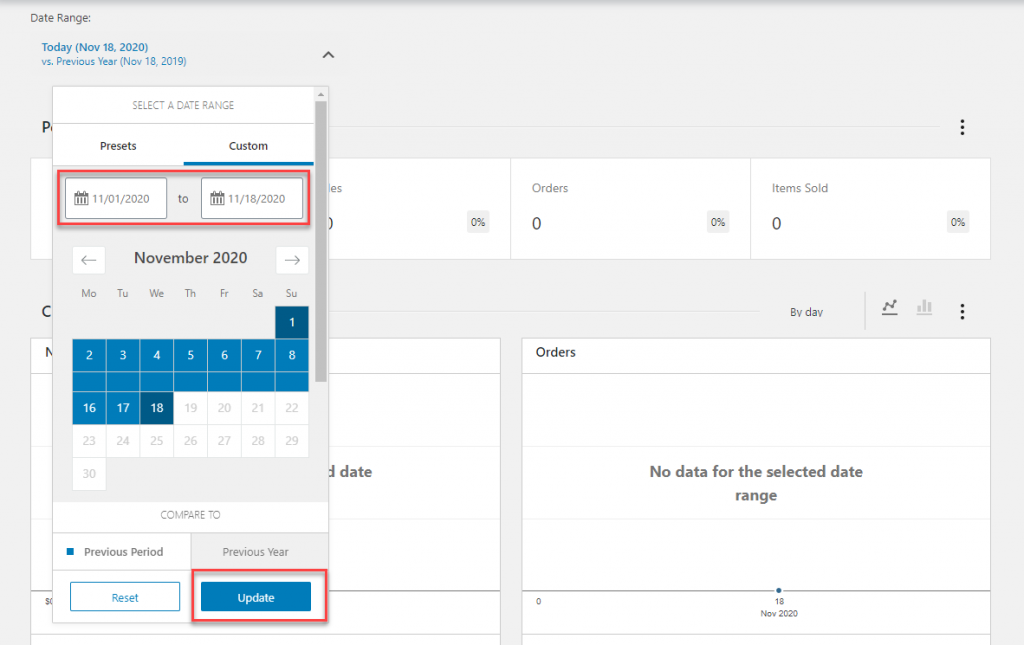
If you don’t want to go for any of the Presets, you can choose Custom.
Here, you can either manually enter the date range, or choose a date from the calendar.
After selecting the date range, you can click the Update button.
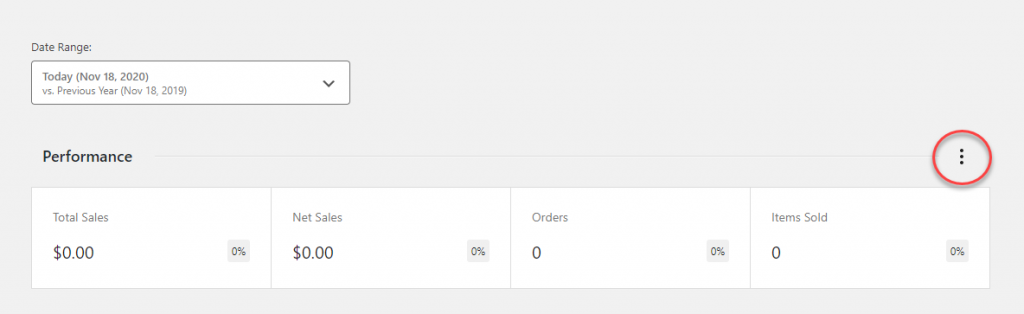
Performance
By default, you will see the Performance section below the Date Range. Here, you can display a selection of statistics that you want to see. You can choose the display statistics by clicking the kebab menu or the three dots menu on the right hand side of the section.
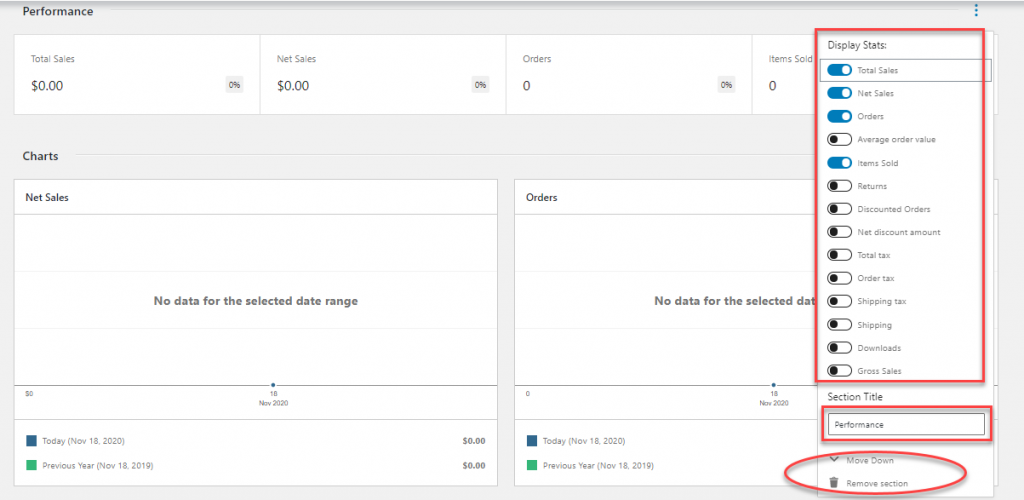
Once you open the menu, you can enable the required statstics. The following display statistics are available under the performance section:
- Total Sales
- Net Sales
- Orders
- Average order value
- Items Sold
- Returns
- Discounted Orders
- Net discount amount
- Total tax
- Order tax
- Shipping tax
- Shipping
- Downloads
- Gross Sales
Below the statistics, you will find a field where you can edit the title of the section.
You can also move this section up or down depending on your requirement, or you can remove it altogether from the Overview page.
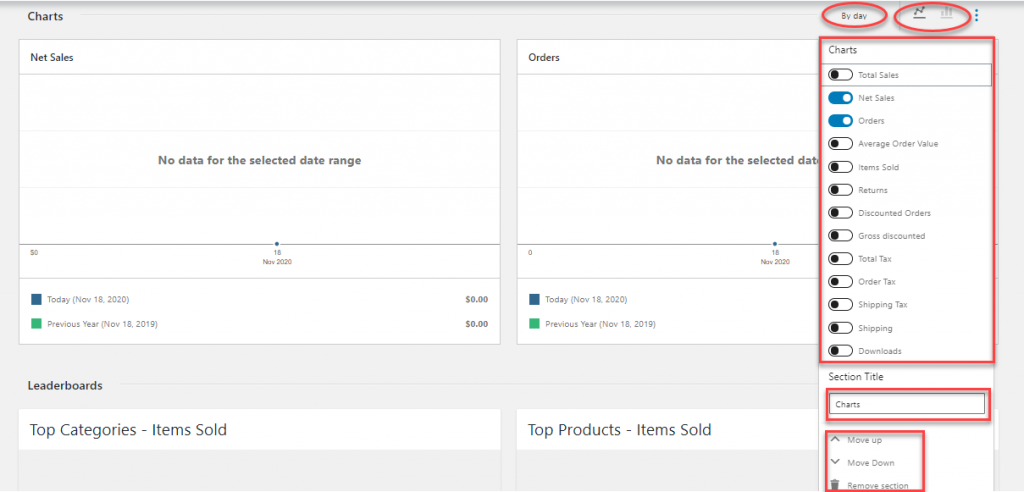
Charts
You can get a visual representation of your store data through Charts. By default, Charts section is displayed below Performance. You can move it up or down as per your requirement. If needed, you can change the title of the section as well. Also, you can choose ‘By day’ or ‘By hour’, based on your needs. This section also lets you choose the type of charts displayed from two options – Line chart or Pie chart.
You can also choose the statistics to be displayed on this page. The following options are available.
- Total Sales
- Net Sales
- Orders
- Average Order Value
- Items Sold
- Returns
- Discounted Orders
- Gross Discounted
- Total Tax
- Order Tax
- Shipping Tax
- Shipping
- Downloads
Leaderboards
You can view the Leaderboards for different statistics on your store here. As the other two options, you can customize the display statistics, change the order on the page, or remove it completely. Here, you can also choose the number of rows displayed per table.
The following statistics are available for you to choose from:

Analytics settings
In the Analytics settings section, you can control the default settings of your Analytics section.
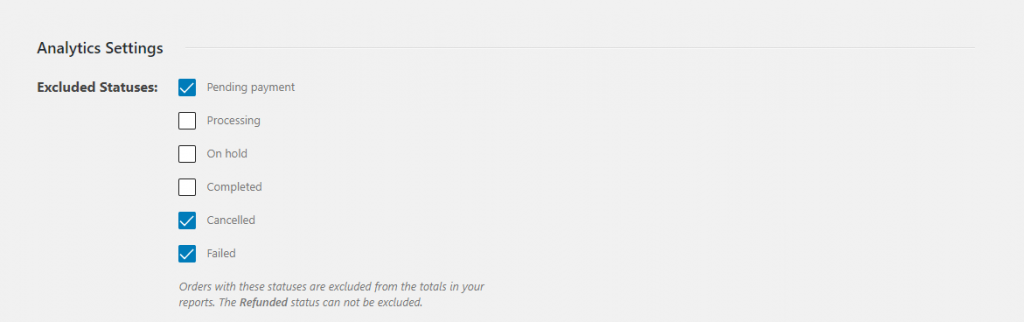
Excluded statuses
First, you can determine which all order statuses are excluded from the reports. You can simply check the order status that you want to be excluded from your reports.
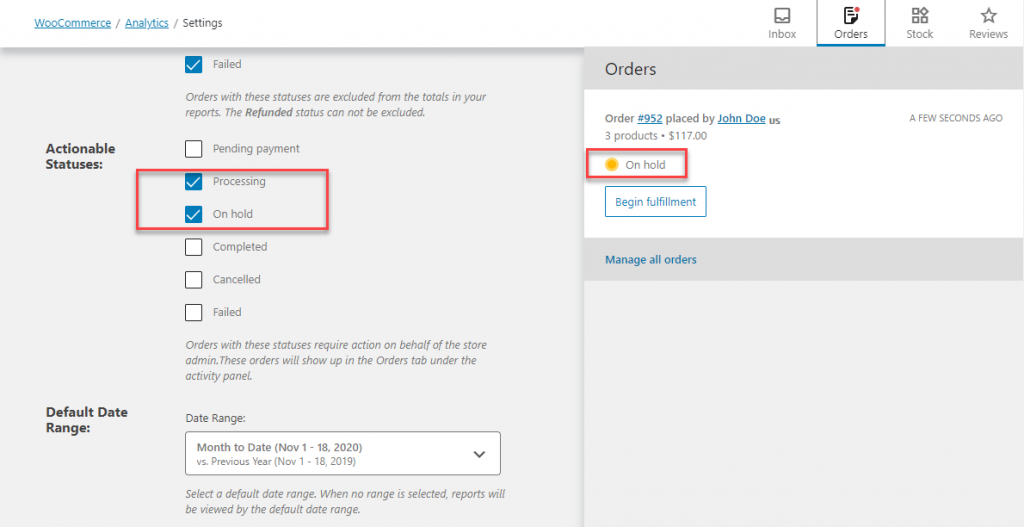
Actionable statuses
In the next section, you can specify the Actionable statuses for orders. The order statuses that you select here will be considered as actionable, and they will be displayed on the Activity panel.
For example, if you have selected ‘On hold’ as an actionable status, orders with this status will be displayed under the Orders Panel. Please check the below screenshot:
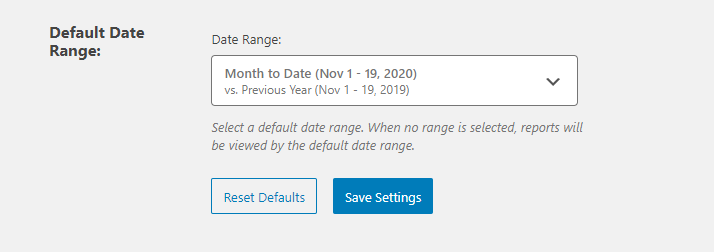
Default Date Range
You can set a default date range for your Analytics reports here. The date range that you choose here will reflect when you open the Overview page or WooCommerce dashboard. With the date picker, you can easily customize the date range in most pages of Analytics.
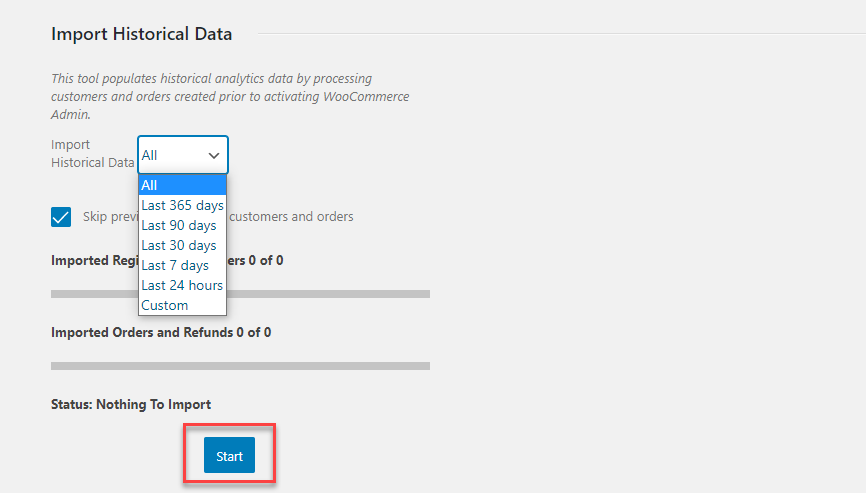
Import Historical Data
Since the Analytics section is a new addition to WooCommerce, you will have to import historical data from your store to populate the reports. You have the following options available to import data:
- All
- Last 365 days
- Last 90 days
- Last 30 days
- Last 7 days
- Last 24 hours
- Custom
Revenue
On this page, you can see the statistics related to your daily revenue. It displays the following statistics:
- Gross Sales
- Returns
- Coupons
- Net Sales
- Taxes
- Shipping
- Total Sales
You can visualize the statistics as Line chart or Pie chart as well. There is also an option to download the reports. You can customize the statistics to be included in the downloaded report.
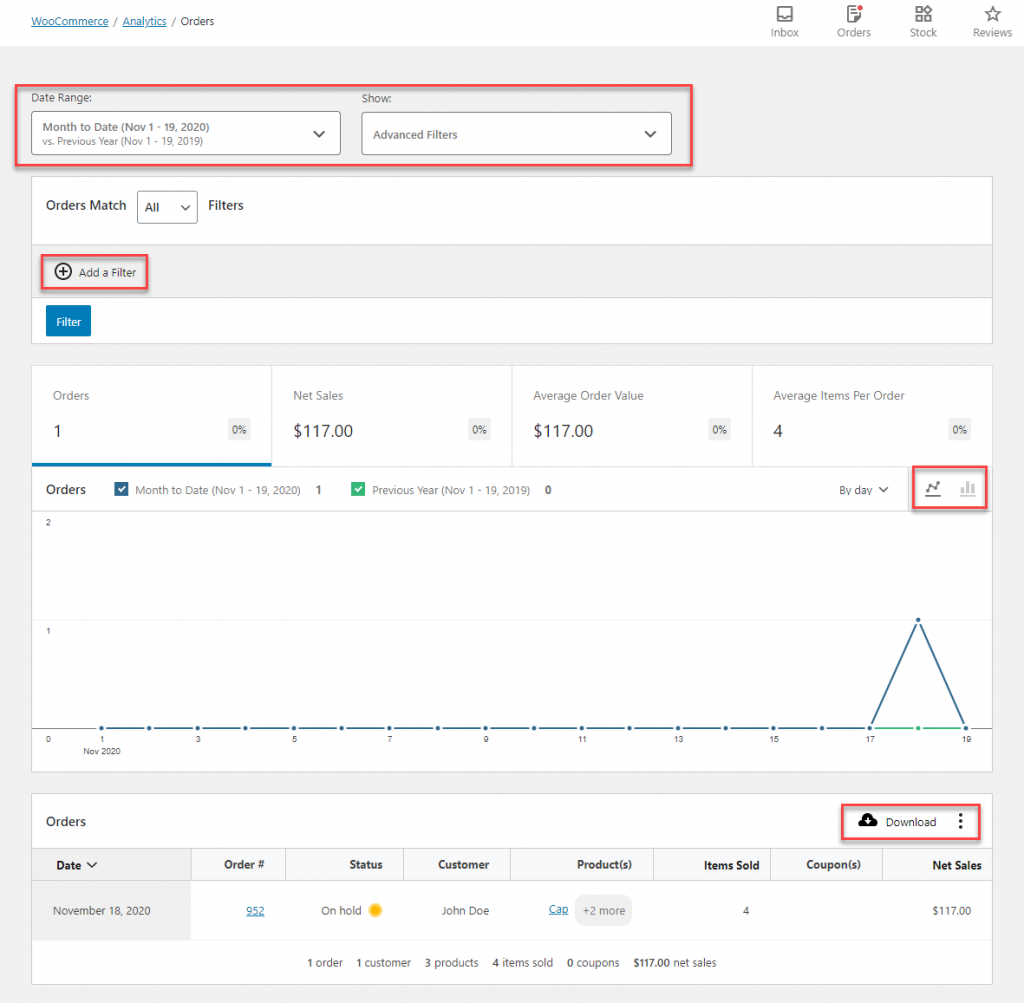
Orders
This page gives you insights on your store’s orders. Orders, Net Sales, Average Order Value and Average Items per order are displayed. There will be a chart display of the statistics as well, which you can choose between line chart or pie chart.
You can filter the orders included in the report by date range as well as advanced filters. The filters include the following:
- Products
- Coupon Codes
- Customer Type
- Refunds
- Tax Rates
- Attribute
You can also download the order details into a CSV file. You can customize the download by choosing to include the following components:
- Status
- Customer
- Products
- Items Sold
- Coupons
Products
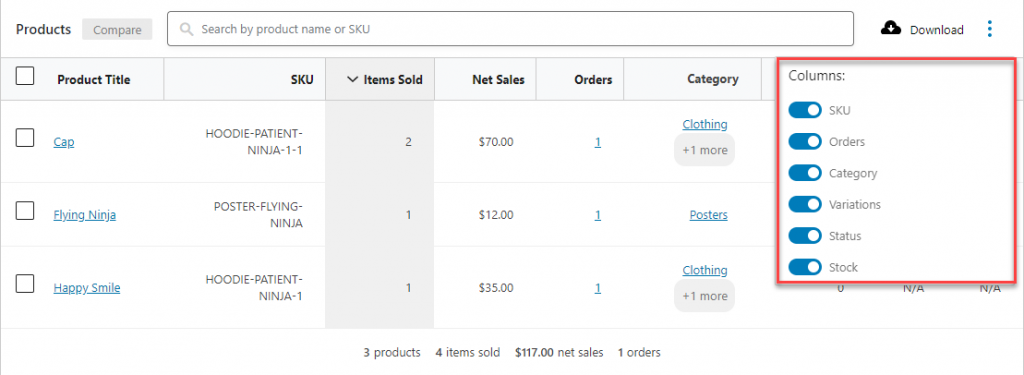
You can view insights on your Product data here. The statistics offered on this page includes Items Sold, Net Sales and Orders. You can get the number for these parameters as well as a visual depiction through Line Chart or Pie Chart.
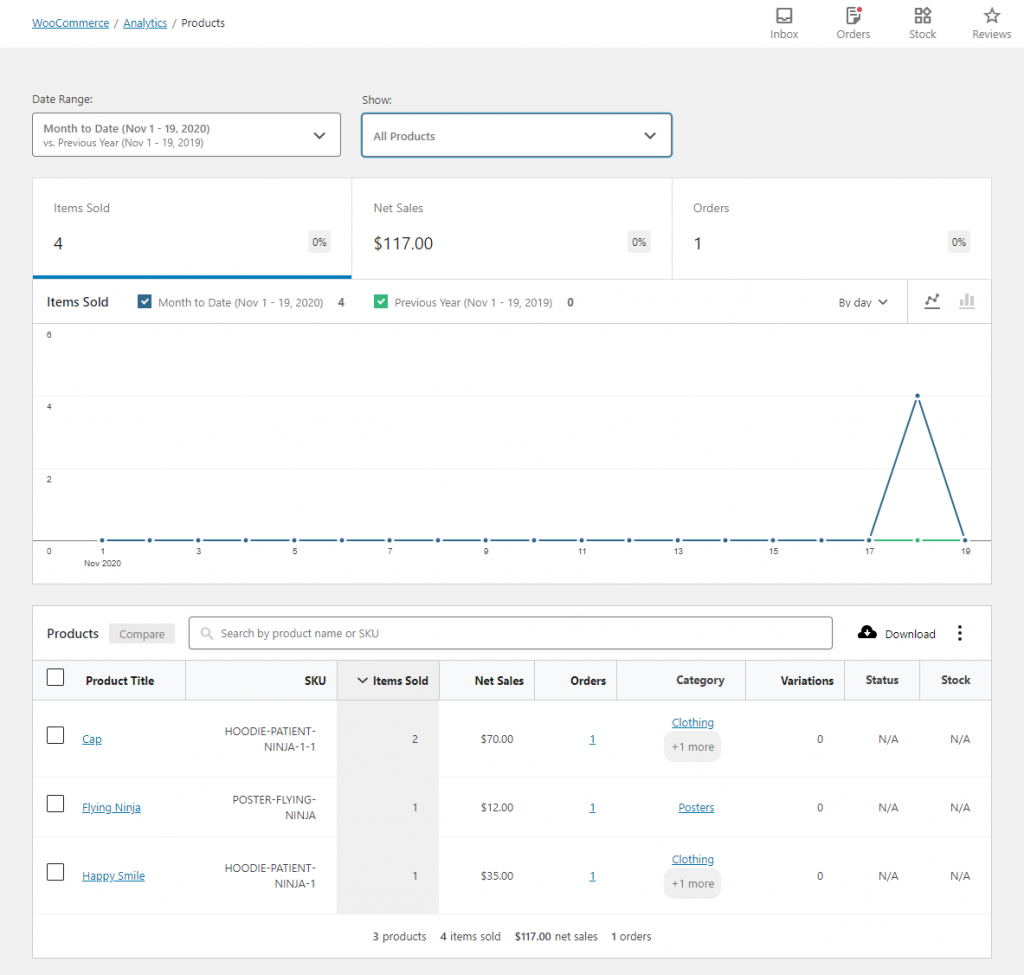
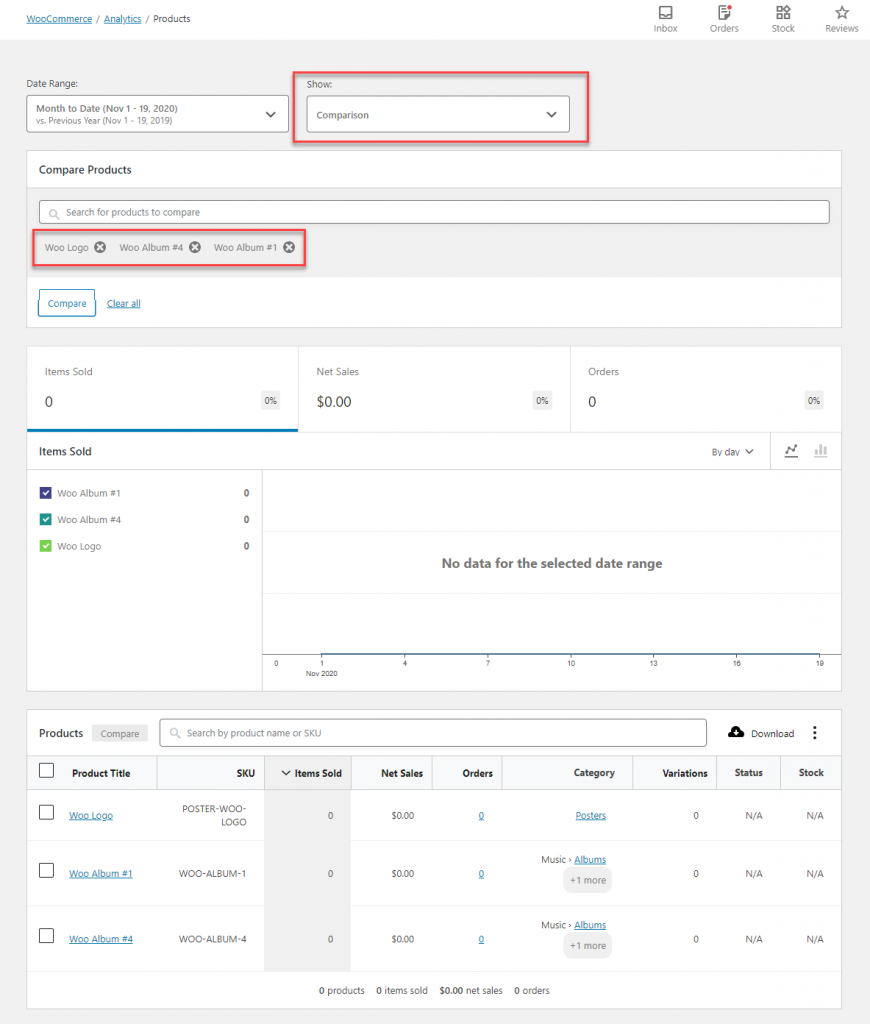
Now, you can customize the report by filtering products in different ways. You can apply a date range, or can choose to show for specific products. There are three options to filter. You can either choose to display data on all products, a single product, or a selective list of multiple product that you specify.
For example, you can choose to display the data related to only a few products that you are interested in, as displayed in the below screenshot.
You can download Products reports with an option to choose the column headers such as:
- SKU
- Orders
- Category
- Variations
- Status
- Stock
Categories
This page gives you data related to different categories on your site. You will find three sections – Items Sold, Net Sales and Orders. Items Sold will be displayed by default. You can also toggle between Line Chart and Pie Chart.
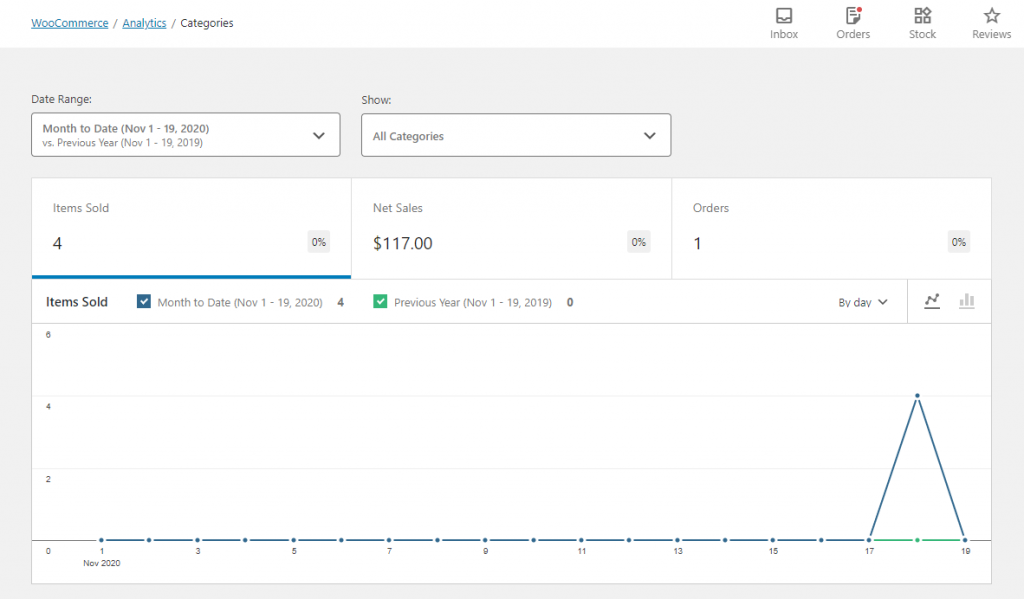
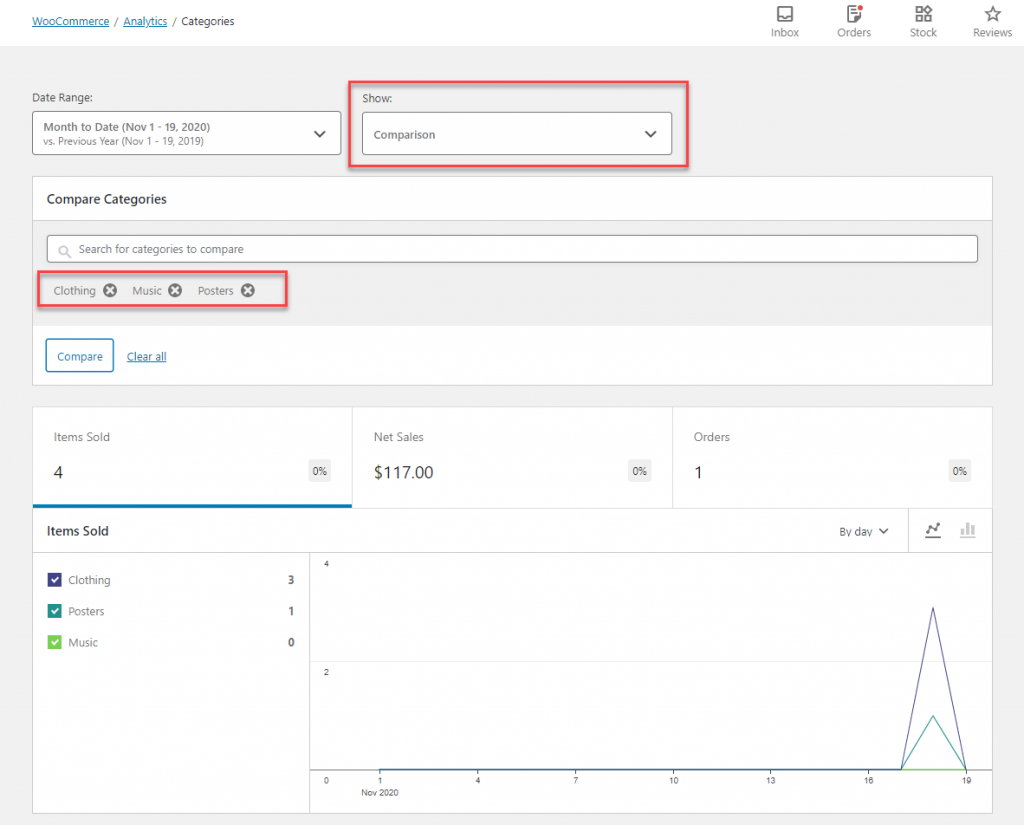
You can filter the categories by specifying the date range or by filtering based on All, Single Category, or Comparison. If you choose Comparison option to filter, you can filter the reports so as to include data from only those categories that you specify.
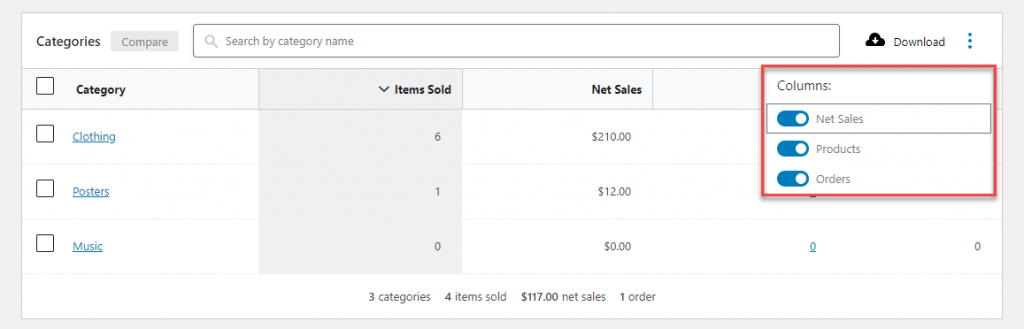
You can download the reports into a CSV file as well, with customization of columns with the following options:
- Net Sales
- Products
- Orders
Coupons
This page displays data related to Coupons on your store. The reports include Discounted Orders and Amount. You can toggle the data between Line Chart and Pie Chart as well.
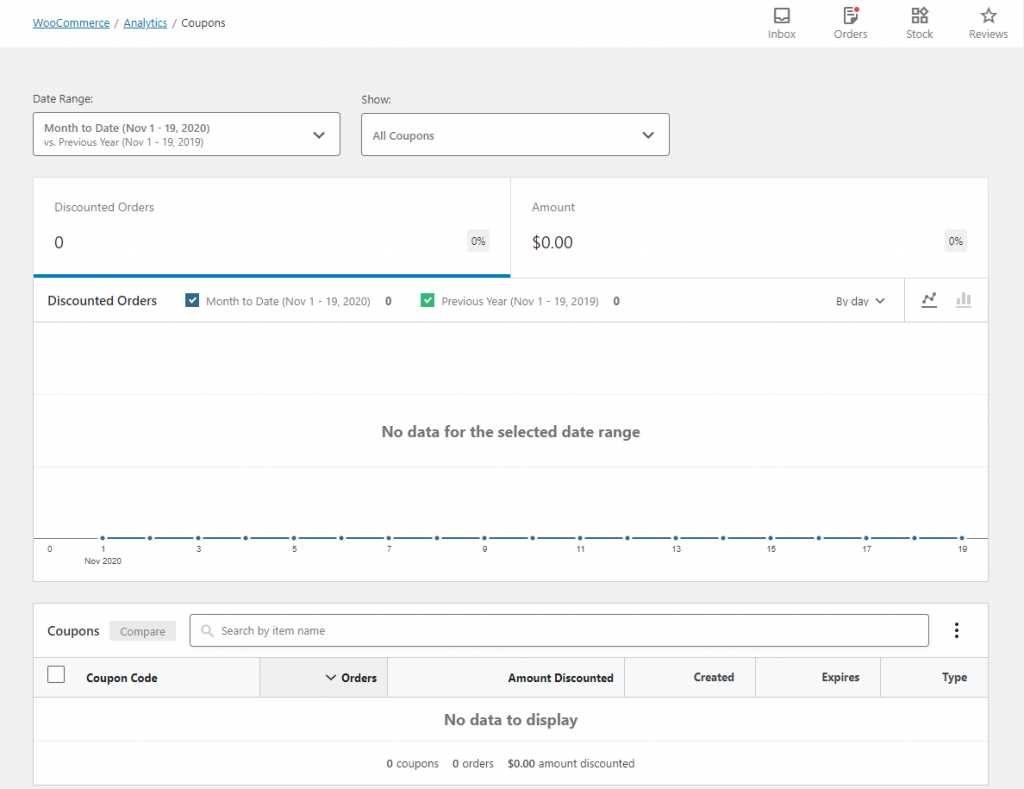
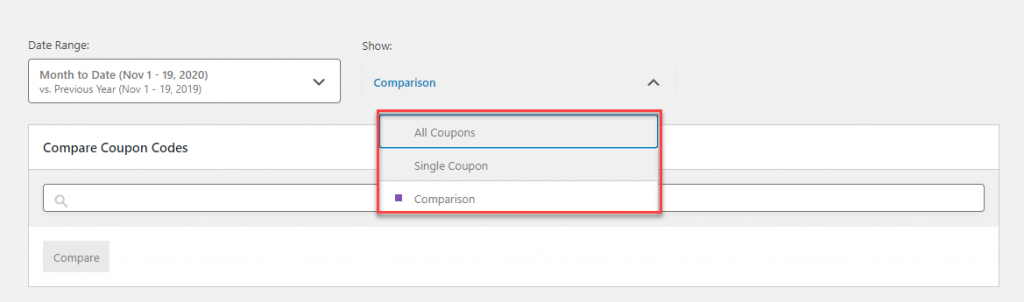
On this page, you can view the data by date range, as well as based on advanced filters. The advanced filter options are:
- All Coupons
- Single Coupon
- Comparison
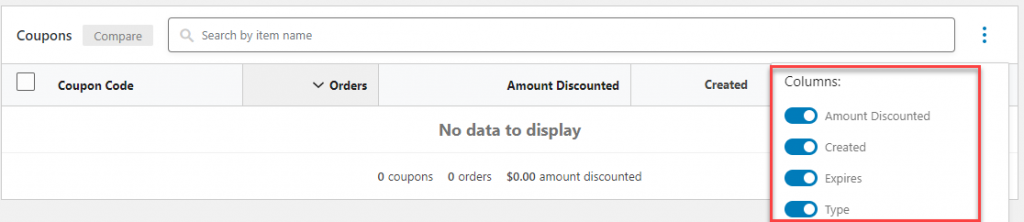
Here, you can also download the reports in a CSV file, which you can customize by specifying the column headers. The options include:
- Amount Discounted
- Created
- Expires
- Types
Taxes
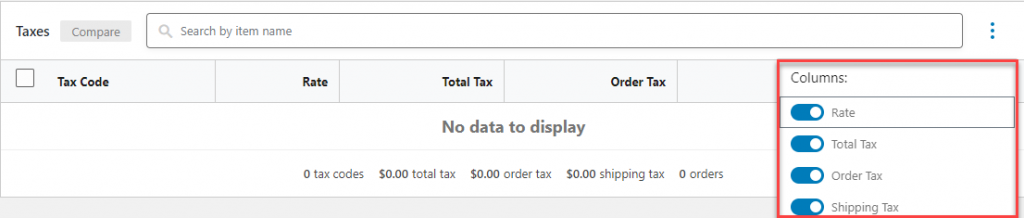
This page gives you insights on the tax collected on your store. By default it displays the Total Tax data with options to visualize between Line Chart or Pie Chart. You will also get reports on Order Tax, Shipping Tax and Orders on this page.
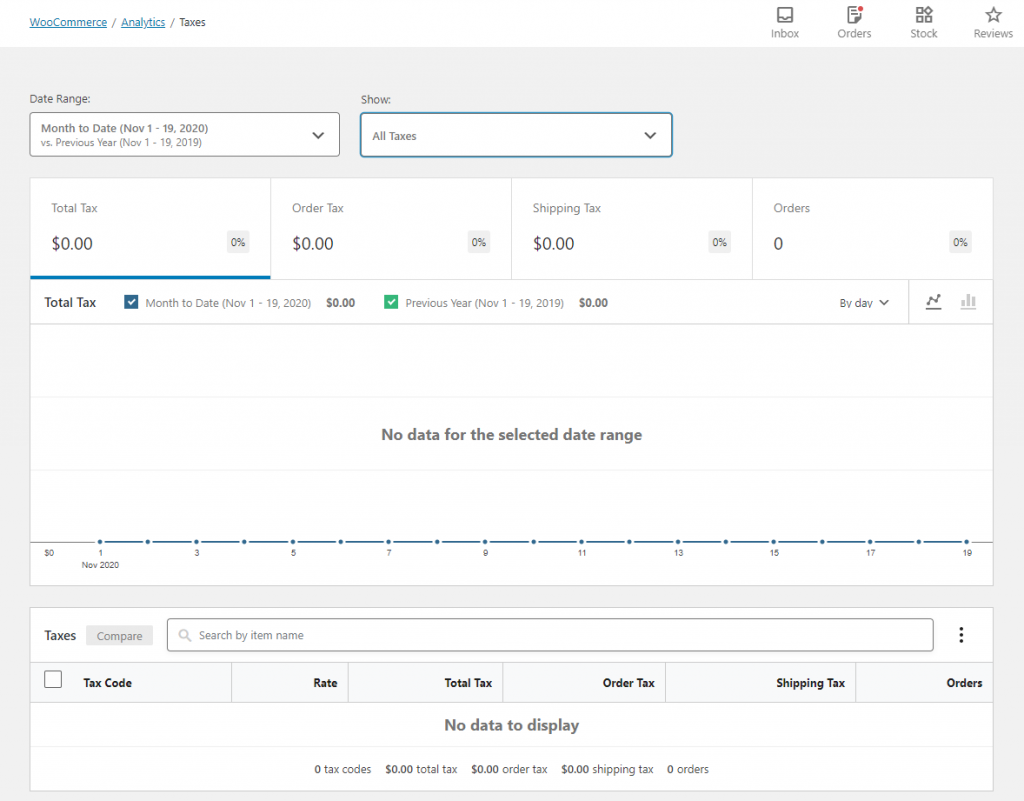
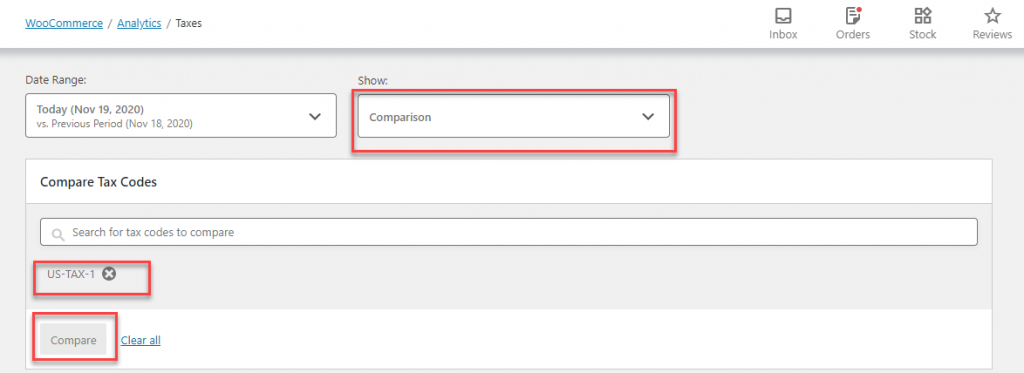
Here you will find filtering options too. First of all, you can filter the data by specifying a date range. Also, you can apply advanced filters – All Taxes and Comparison. With the option for All Taxes, the entire tax amount collected during the date range will be displayed.
By using the Comparison filter, you can get the data specific to different tax rates you may have on your store. To get the specific tax data, you can choose the Comparison option in the filter, and then specify the tax code of the rate that you want to see.
There is also an option to download Tax reports. You will find the following column headers to choose from:
- Rate
- Total Tax
- Order Tax
- Shipping Tax
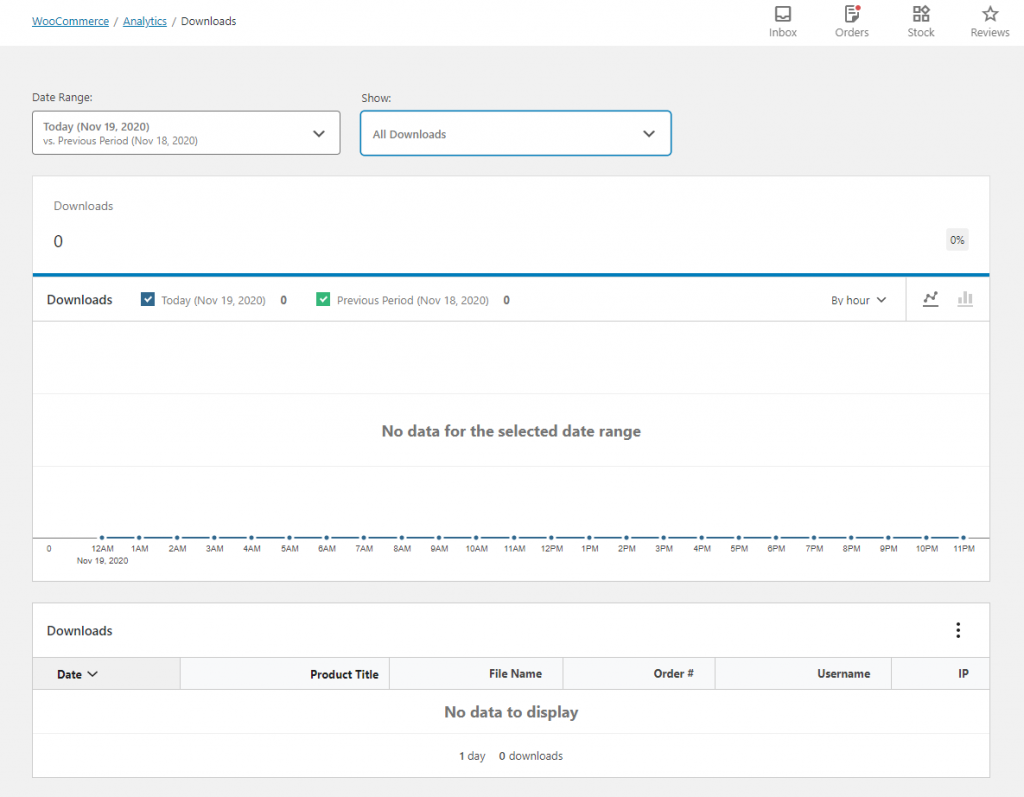
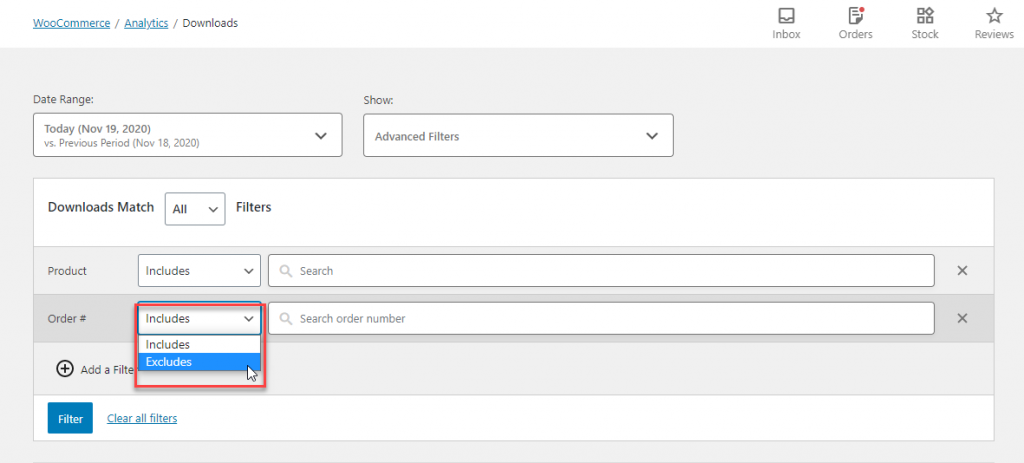
Downloads
This page provides you with insights on the performance of your downloadable products. By default, the entire download count of your store will be displayed here. This includes multiple downloads from the same IP address as well.
You can filter the products by date range, as well as use some advanced filters. The advanced filters available are:
- Product
- Username
- Order #
- IP address
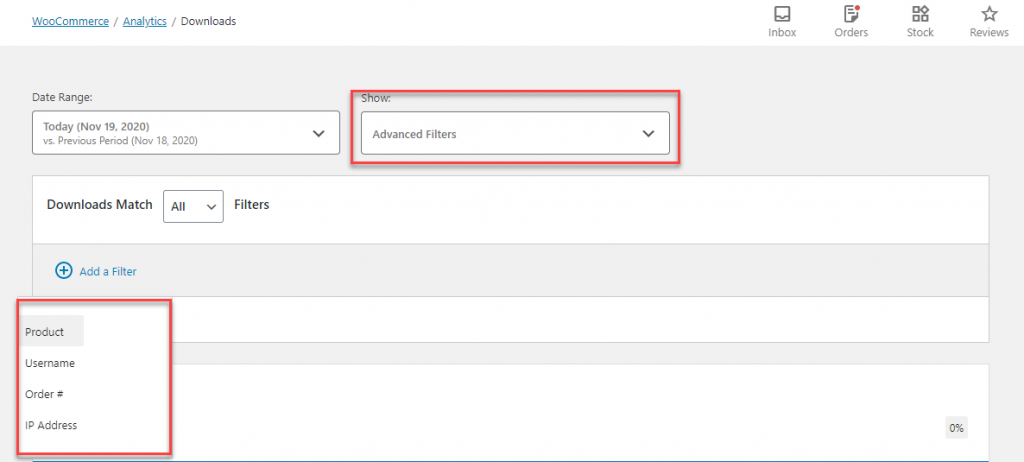
Once you add a filter, you can perform the search by including or excluding the specified search parameter.
As with the other reports, you can download the report here as well. You have the following options to choose from for column headers:
- File name
- Order #
- Username
- IP
Stock
This page will display the stock details of your store. By default, the inventory details of all products will be listed. You need to enable Stock Management to get this report.
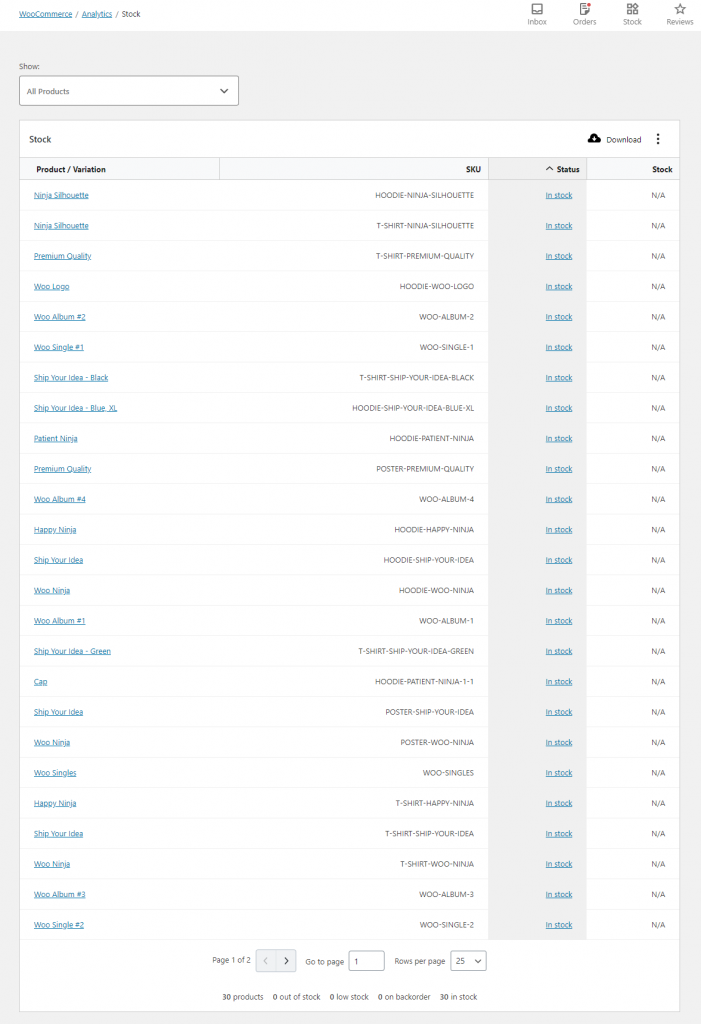
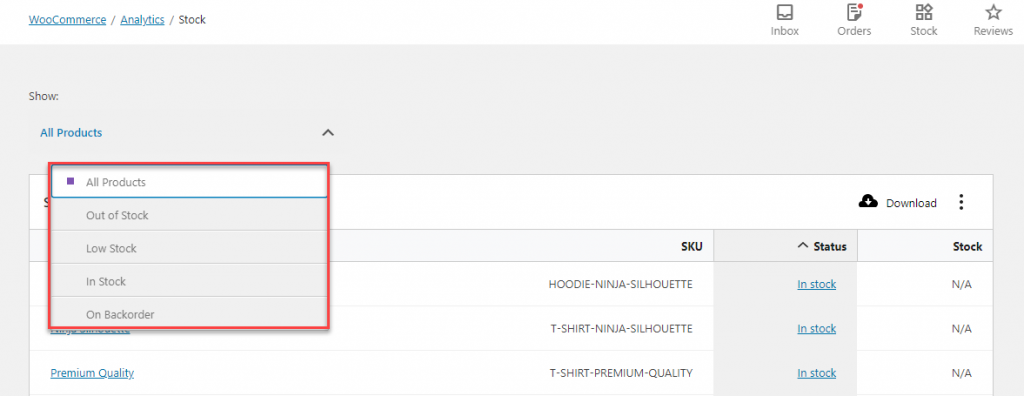
You can further sort the data by the following stock statuses:
- Out of Stock
- Low Stock
- In Stock
- On Backorder
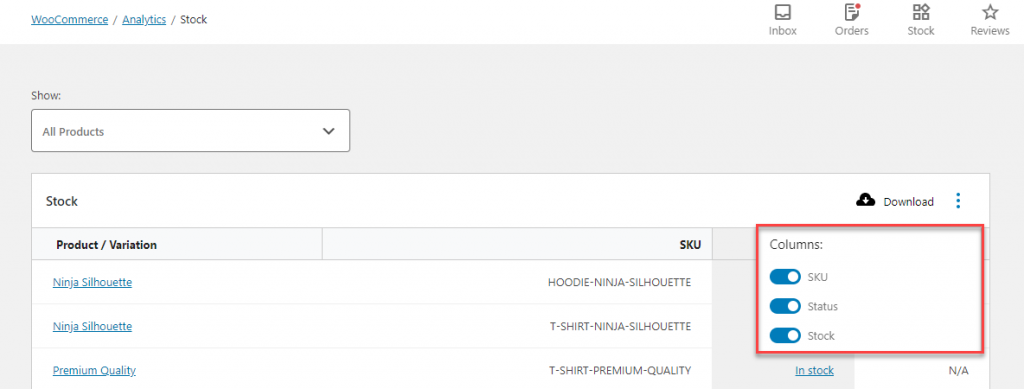
You can also download Stock reports with the following options for column headers:
- SKU
- Status
- Stock
We have covered all the different analytics reports available with WooCommerce by default. These are available in the latest version of WooCommerce, and there is an option to import historical data from your store. This way, you can keep track of your data even from the period before the WooCommerce Analytics tool was introduced.
If you want to integrate Google Analytics into your store, the following articles will be able to help you out:
- How to add Google Analytics to your WooCommerce store?
- Best plugins to integrate Google Analytics to WooCommerce.
- Identify the relevant aspects to analyze in an eCommerce store.
- Adding Google Tag Manager to WordPress.
- WooCommerce reporting and analytics plugins.
- Using Sales Analytics to Track Business Growth
Leave us a comment if you have a query.


")
")
")