
How fast a website is loaded is an important parameter of user experience. As a website owner, you will be constantly watching your site’s performance, and trying to find any potential issues affecting it. Google PageSpeed Insights is a great tool to help you identify any issues that could be hindering your site’s performance. In this article, we will discuss how you can use Google PageSpeed Insights to ensure consistently superior performance on your site.
Google PageSpeed Insights – An Overview
Google PageSpeed Insights is a tool that offers detailed reports about your site’s performance on mobile and desktop devices. It offers data from controlled environments as well as from real-world scenarios. This will give you a better perspective on the actual performance indicators of your website. To get an idea easily after a speed test, you can rely on the performance score that will be visible on the reports page. A performance score above 90 is ideal, while 50-90 is a score that needs improvement, and below 50 is considered to be a poor score.
How to use Google PageSpeed Insights?
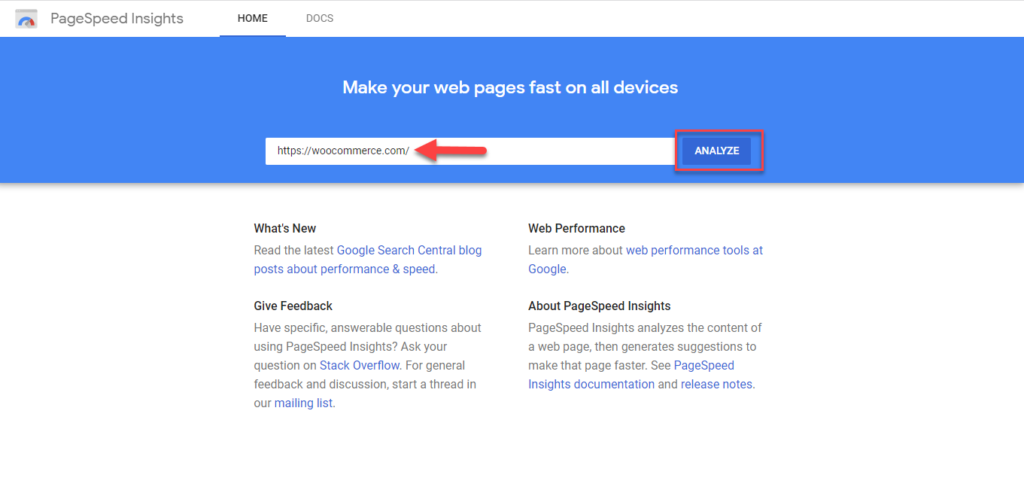
It is quite simple to get the insights. Go to the website, and enter the url that you want to analyze, and click the Analyze button.
It will give you the results within a few seconds. You can toggle between mobile and desktop reports. The performance score will be displayed at the top of the results page, followed by different sections of data. These include Field Data, Lab Data, and Audits.
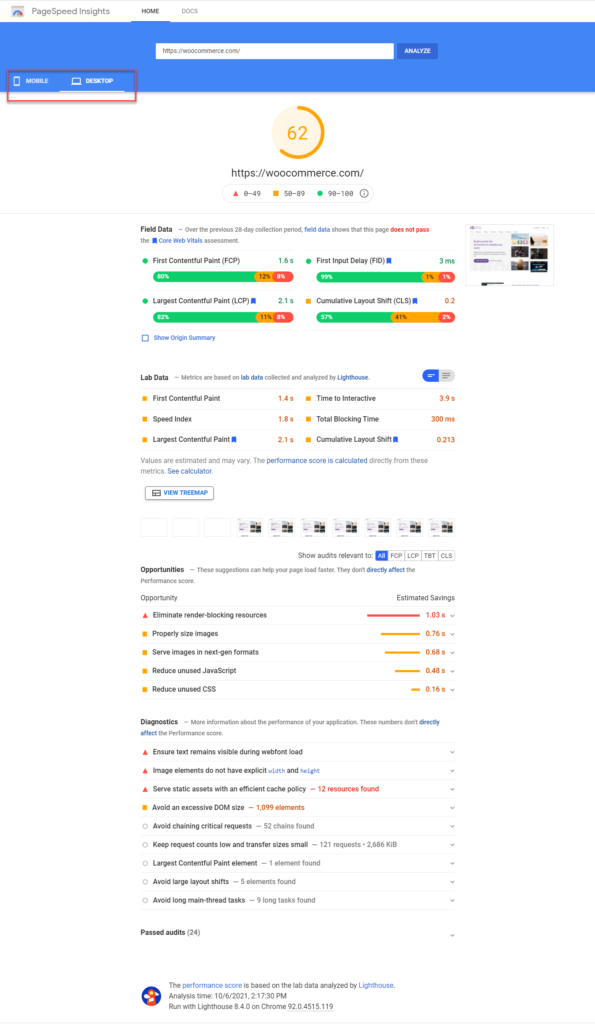
How to interpret Google PageSpeed Insights Field Data
Google PageSpeed Insights looks into the Chrome User Experience Report to give you a detailed report on Field Data. The report will have the following metrics:
- First Contentful Paint (FCP) – denotes the time taken for the first rendering of text or image by the browser
- First Input Delay (FID) – quantifies the user experience while dealing with a non-responsive page
- Largest Contentful Paint (LCP) – denotes the time taken to load the main content on the page.
- Cumulative Layout Shift (CLS) – indicates unexpected layout shifts experience by the user.
Google considers the following scores to be good, need improvement, and poor for each of these datasets:
Good
| Data | Score |
|---|---|
| FCP | [0, 1800ms] |
| FID | [0, 100ms] |
| LCP | [0, 2500ms] |
| CLS | [0, 0.1] |
Needs improvement
| Data | Score |
|---|---|
| FCP | [1800ms, 3000ms] |
| FID | [100ms, 300ms] |
| LCP | [2500ms, 4000ms] |
| CLS | [0.1, 0.25] |
Poor
| Data | Score |
|---|---|
| FCP | over 3000ms |
| FID | over 300ms |
| LCP | over 4000ms |
| CLS | over 0.25 |
How to interpret Google PageSpeed Insights Lab Data?
With the help of Lighthouse, an automated tool that helps in enhancing the quality of web pages, PageSpeed Insights offers certain metrics categorized as Lab Data in the results page. These are:
- First Contentful Paint – the time it takes to render the first text or image
- Largest Contentful Paint – the time it takes to render the largest text or image
- Speed Index – denotes how fast contents of a web page are populated.
- Cumulative Layout Shift – indicates unexpected layout shifts experience by the user
- Time to Interactive – the time it takes for a web page to become totally interactive.
- Total Blocking Time – the total time period between FCP and Time to Interactive
The performance score of a web page is calculated based on these data.
Audits
The data from Audits are available in three different sections – Opportunities, Diagnostics and Passed Audits.
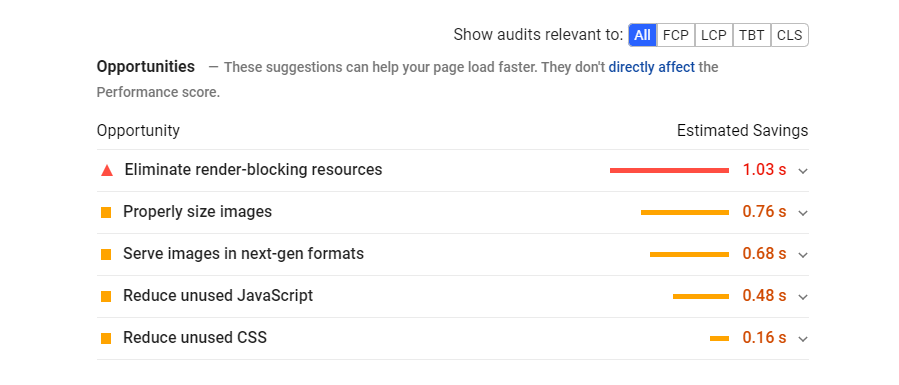
Opportunities – These are suggestions to improve the page loading speed of your website. This gives an estimate on how fast the page will load if you implement the improvement suggestion.
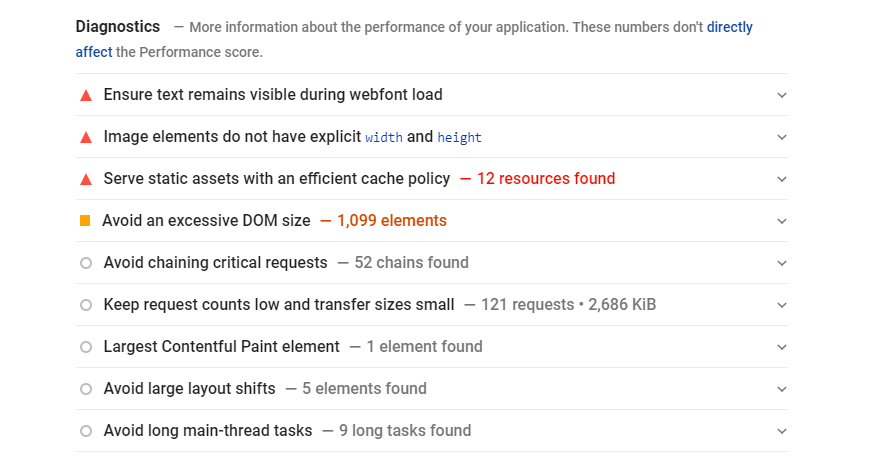
Diagnostics – This is a list of additional insights that indicates how much a web page is in alignment with the best practices of web development.
Passed audits – This section displays all the different audits that the web page passed.
How to improve Google PageSpeed Insights Score
Now, we will discuss a few strategies you can adopt to improve the Google PageSpeed Insights score. These are:
Image optimization
One of the important aspects that contribute to better score with Google PageSpeed Insights is image optimization. You need to ensure that the images uploaded to your websites are of proper size. Using ‘responsive images’ that are optimized according to the device. ‘Lazy Loading’, or only loading images that are currently visible on the screen, contributes a lot to better site performance.
Image compression is another important factor that will help with your efforts to improve Google PageSpeed Insights score. If you are looking for tools to compress images our article on the Best WordPress Image Compression Plugins to Speed Up your Site could help. Also, using file formats like WebP for images could help in improving site performance.
Reduce server response times
Another recommendation by experts to enhance Google PageSpeed Insights score is reducing server response times. There are several strategies that you can implement to reduce server response times. These include:
- Leveraging a content delivery network (check out How to configure CDN)
- Implementing browser caching (understand more about browser caching)
- Investing a reliable hosting service (best hosting service providers).
- Keeping only essential plugins.
- Using a lightweight theme.
Minification
You can reduce the size of CSS, JavaScript and HTML files by removing non essential characters, duplications, etc. Also, if there are unused CSS files on the site, you can completely remove them.
AMP
To optimize mobile experience of your site, you can make use of AMP or Accelerated Mobile Pages. This will remove any content or features that are not relevant to a user accessing your site through a mobile device.
Reduce redirects
Redirects are an essential aspect of a website as it prevents bad user experiences due to broken links. However, too many redirects on your page can negatively impact your PageSpeed Insights score. This is because too many redirects could result in longer loading times on your site.
We hope this article has provided you with a good idea on how to use Google PageSpeed Insights for identifying and fixing site performance issues. Feel free to leave us a comment if you have any queries or concerns.


")
")
")
@Sujith Reghu, thanks, I really appreciate that you answered my question. Now I know better. Thanks again!
Thanks for sharing this article. This is helpful indeed to those who just have their website or to those who want to improve their website page speed. I just got a question, if your website is already mobile-friendly or already responsive, is there a need to use AMP? The website works well on mobile or is it not about how well it works on mobile?
Hi Louise, AMP will help your pages load faster on mobile devices, while a responsive design ensures that your site users will have an optimized experience while accessing your website. So, we can’t just ignore one for the other. Depending on the complexity of your site, you may still have to use AMP even if the site is responsive.